Compute a score matrix for observed data based on the expected for a given set of points
shaman_kk_norm
shaman_kk_norm(obs, exp, points, k = 100, k_exp = 100)
Arguments
| obs | Dataframe containing the observed points |
|---|---|
| exp | Dataframe containing the expected (shuffled) points. |
| points | A score will be computed for each of the points. |
| k | The number of neighbor distances used for the score on observed data. For higher resolution maps, increase k. For lower resolution maps, decrease k. |
| k_exp | The number of neighbor distances used for the score on expected data. Should reflect the ratio between the total number of observed and expected over the entire chromosome. |
Value
NULL if insufficient observed data, otherwise resturns a list containing 3 elements: 1) points - start1, start2 and score for all observed points. 2) obs - the observed points. 3) exp - the expected points.
Details
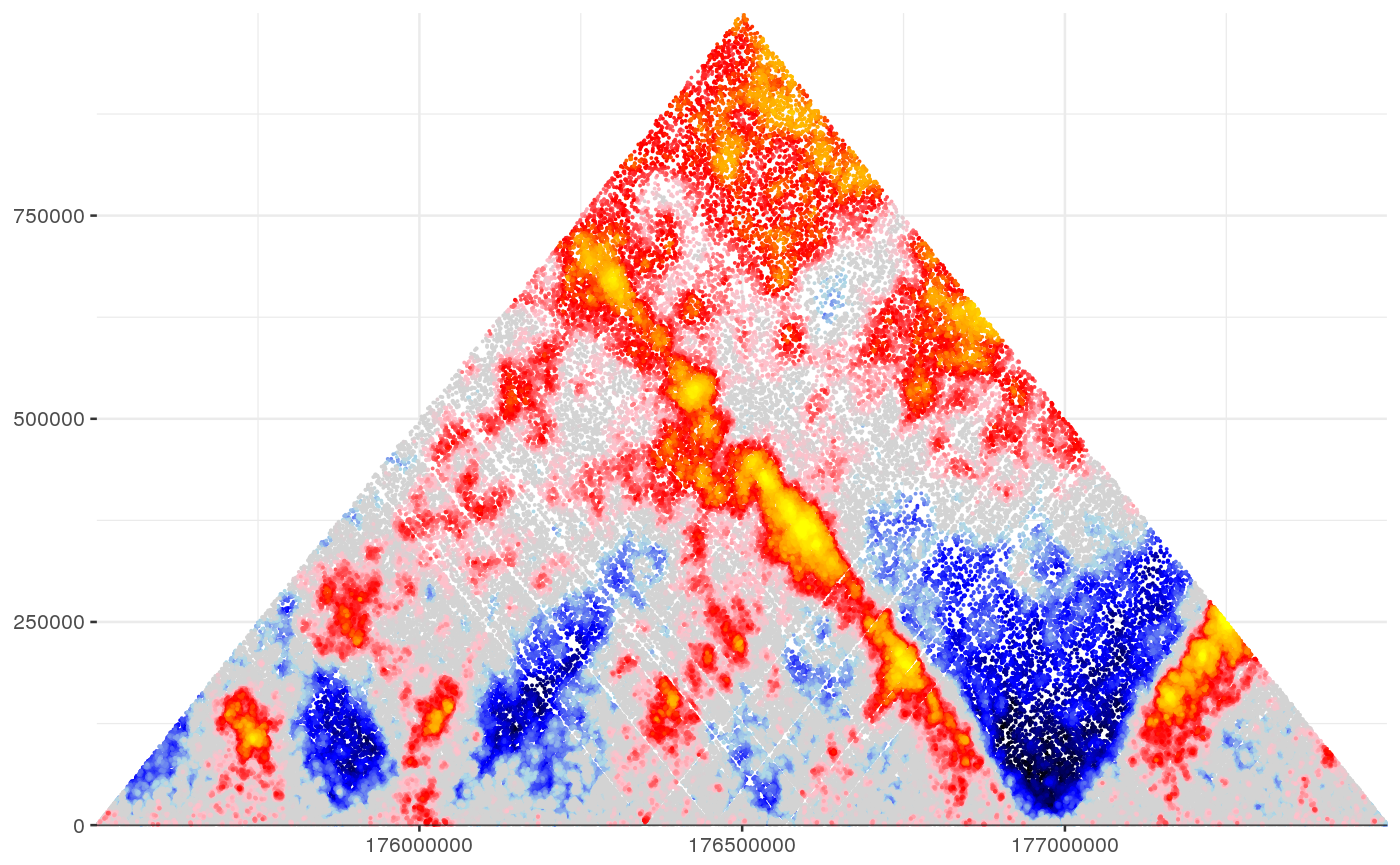
This function receives observed and expected data and compute the score on a given set of points. The score for a point is the KS D-statistic of the distances to the points k-nearest-neighbors
Examples
#Set misha db to test gsetroot(shaman_get_test_track_db()) points <- gextract("hic_obs", gintervals.2d(2, 175.5e06, 177.5e06, 2, 175.5e06, 177.5e06), band=c(-2e06, -1024)) obs <- gextract("hic_obs", gintervals.2d(2, 175e06, 178e06, 2, 175e06, 178e06), band=c(-2e06, -1024)) exp <- gextract("hic_exp", gintervals.2d(2, 175e06, 178e06, 2, 175e06, 178e06), band=c(-2e06, -1024)) mat_score = shaman_kk_norm(obs, exp, points, k=100, k_exp=200)#>#>#>#>