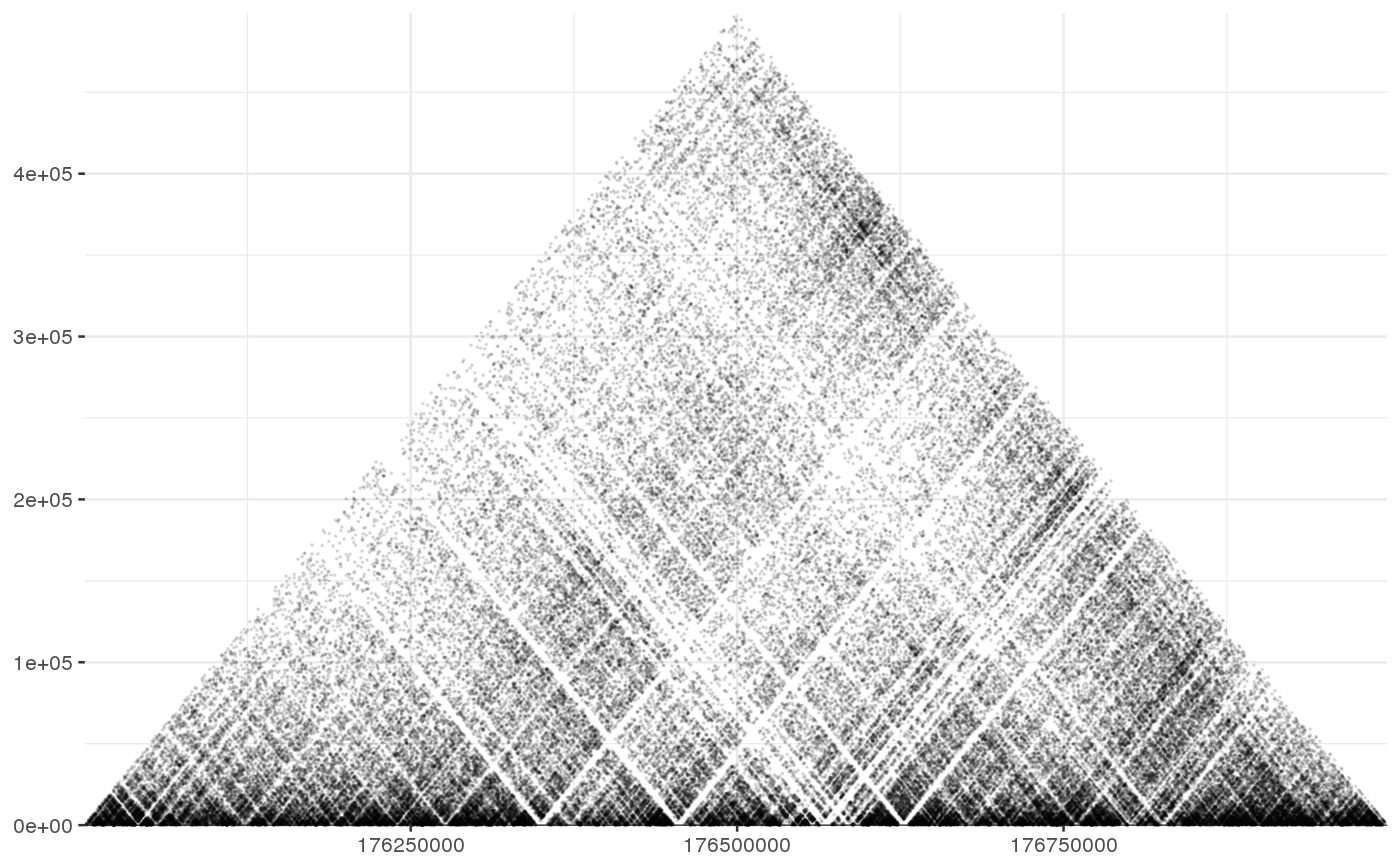
plot an observed or expected hic map
shaman_gplot_map
shaman_gplot_map(points, interval_range = NA, rotate = TRUE,
  point_size = 0.1, add_axis = TRUE)
Arguments
| points | A dataframe containing the points (start1, start2). |
|---|---|
| rotate | Binary flag, indicating if the plot should be rotated by 45 degrees. |
| point_size | Cex size of the points in the plot. |
| add_axis | Binary flag, indicating if axis should be added to plot. |
Value
gplot containing the map
Details
Plots hic contact matrix.
Examples
#Set misha db to test
gsetroot(shaman::shaman_get_test_track_db())
points <- gextract("hic_obs", gintervals.2d(2, 176e06, 177e06, 2, 176e06, 177e06))
shaman_gplot_map(points)